Summary
After an introduction to the history of hacking, the book starts off with the first chapter talking about control structures, followed by some examples of pseudo-code. If you are not already familiar with control structures, it would be wise to do further reading. This is one of the most fundamental concepts of programming.
This part of the book gets into the basics of compiling and using the disassembler using examples from the book. The code examples from this chapter are all C when you’re running programs, but you will see more Assembly once you start debugging. A lot of the examples will teach you the basics of using the compiler and disassembler.
The thing that stood out the most for me with these examples was being shown more efficient methods for some of the commands further into the book. “Now they tell me!” was often uttered through my gritting teeth. A large portion of the chapter also gets into memory segmentation and should be studied at length in addition to reading this book. Toward the end of the chapter, there are sections going over permissions, specifically building on what you’ve already learned with the C program examples. Make sure you have the CD, or download the ISO. You are going to need it for the whole book.
Concepts covered
gcc: Your C compiler that translates C programs into machine language. Running this on your program will create a linker file (a.out) that will run the program ./a.out like the example below for firstprog.c
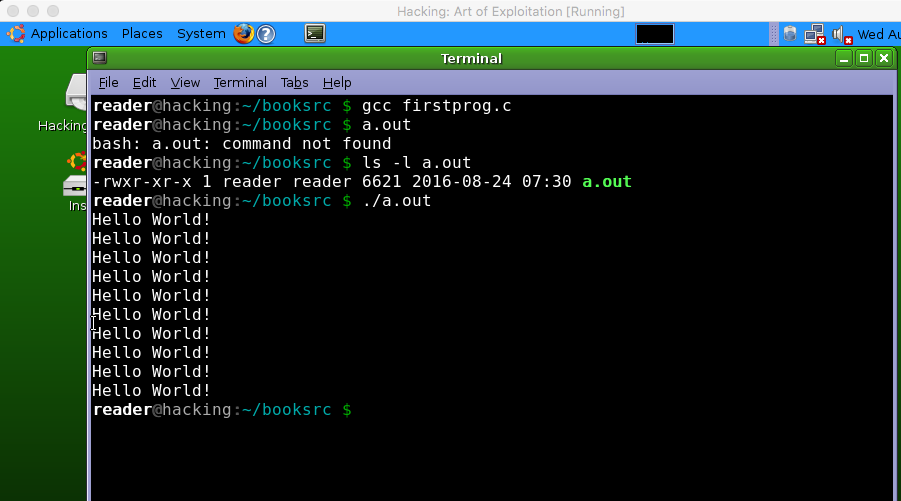
Do yourself a favor and add the -o switch when you run gcc e.g. gcc -o <executable name> <program name>.c. It seems trivial now, but trust me it will become tedious in the future.
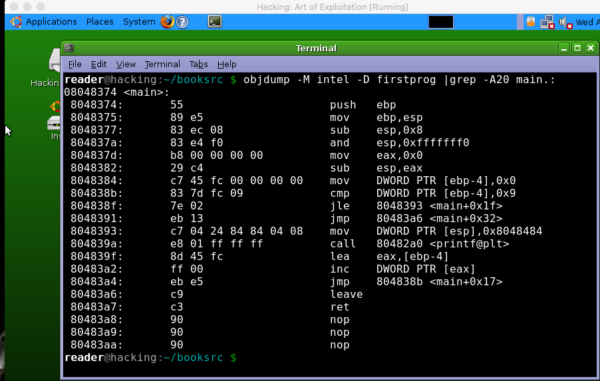
objdump: objdump was used early in the chapter but not as much once diving deeper into assembly and using gdb. particularly two command switches used, -D (disassemble), or -M <Intel/AT&T> to specify the disassembly type (intel or AT&T). This command dumps (disassembles) the executable program for your viewing pleasure. Don’t worry, I explain the output further down.
gdb: The debugger commonly used to examine program memory and view processor registers. By examine, I mean slowly run a program by memory address rather than running it all at once. The difference between this and objdump is objdump will show you the executable by its memory addresses, but gdb is where the program can be ran by individual points in the memory addresses through breakpoints.
So earlier I mentioned I would explain the output from objdump. The key to remember are the four columns you’ll see when you are debugging. Brief explanations of the columns from left to right are below based on what’s on the first line.
- Memory address (0x8048374) . Think of this as the line number for the machine code. This is the particular address of a byte of memory represented in hexadecimal notation.
- Byte Code (55). These are hexadecimal bytes that are machine language instructions for the x86 processor and are merely hexadecimal representations of the binary bytes the CPU understands.
- Operations (push). Operations have a one to one relationship with the byte code. This is the part of a program that moves memory around, performs basic math, or interrupts the processor.
- Registers (ebp). Registers are used to read or write data and act as pointers for various instructions.
More on Registers
Registers are internal variables which vary on the processor, but for the sake of context, these registers are applicable to x86 processors. These variables are built directly into the processor and are used to read or write data. This is one of the more difficult concepts of this chapter (especially if you’re new to this) so you might want to chew thoroughly to ensure digestion.
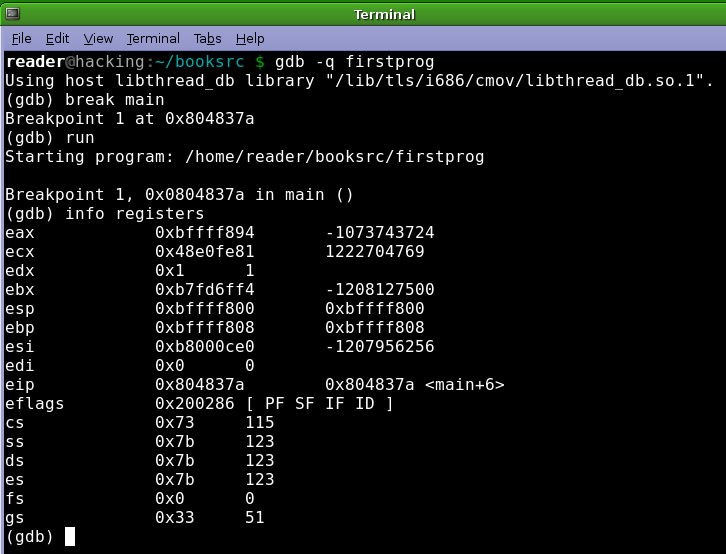
Based on the picture above, the displayed registers fall into these categories:
(eax, ecx, edx, ebx): General purpose registers that typically act as temporary variables when executing machine instructions. The ones are above are the accumulator, counter, data, and base respectively
(esp, ebp, esi, edi): These are also general purpose, but they are sometimes known as indexes and pointers (stack, base, source, destination). esp and ebp are known as pointers because they store 32 bit addresses which point to a location in memory. esi and edi
Initially I thought all four columns were assembly but as it turns out, the first column is the memory address, the second being the machine language (converted to hexadecimal). The third column is the operation or what the column is the Operation for the register. So not so basically, on memory address 0x8048374 byte code 55 does a push operation on the ebp register.
breakpoint
Setting these allows you to stop a running program in progress when you are doing dynamic analysis. Think of it as the pause button when you’re watching a movie. For example, if you were skeptical about whether or not Han Solo shot first, you would create breakpoints (pausing) in the scene and play it back and forth.
x/i (examine instruction)
This command allows you to examine a specified number of lines of instruction, so if you’re wanting to look at the next five instructions for example you would use x/5i.
Memory Segmentation
I’ll have to add more later, but there are five segments a program is divided into: text, data, bss, heap, and the stack. To be honest, a lot of this made much more sense after I ran some programs through Immunity debugger. In fact, check out my article on reverse engineering, then come back to this section. It will make a lot more sense.
The text segment is what you see written in assembly code. The data/bss segments store global and static program variables, the heap is the segment the programmer can directly control and the stack is more or less the scratch pad for local variables (pg 69-70). I cannot stress enough, if you haven’t already, open up a couple executables in Immunity Debugger.
Resources
Tutorialspoint for Assembly (There is a mobile app)
[…] Part1||Part2||Part3||Part4||Part5||Part6 […]